January 8, 2026
December’s Big Finish
The Impact of California’s End-of-Year Storms
Last month, we looked at December through a historical lens— seeing how precipitation can be wildly variable and that December rarely tells the full water-year story.
December 2025 started quietly, but finished strong.
Late-month storms delivered significant gains across California’s major hydrologic regions, quickly reshaping water-year totals.
Before and After: A Regional Snapshot
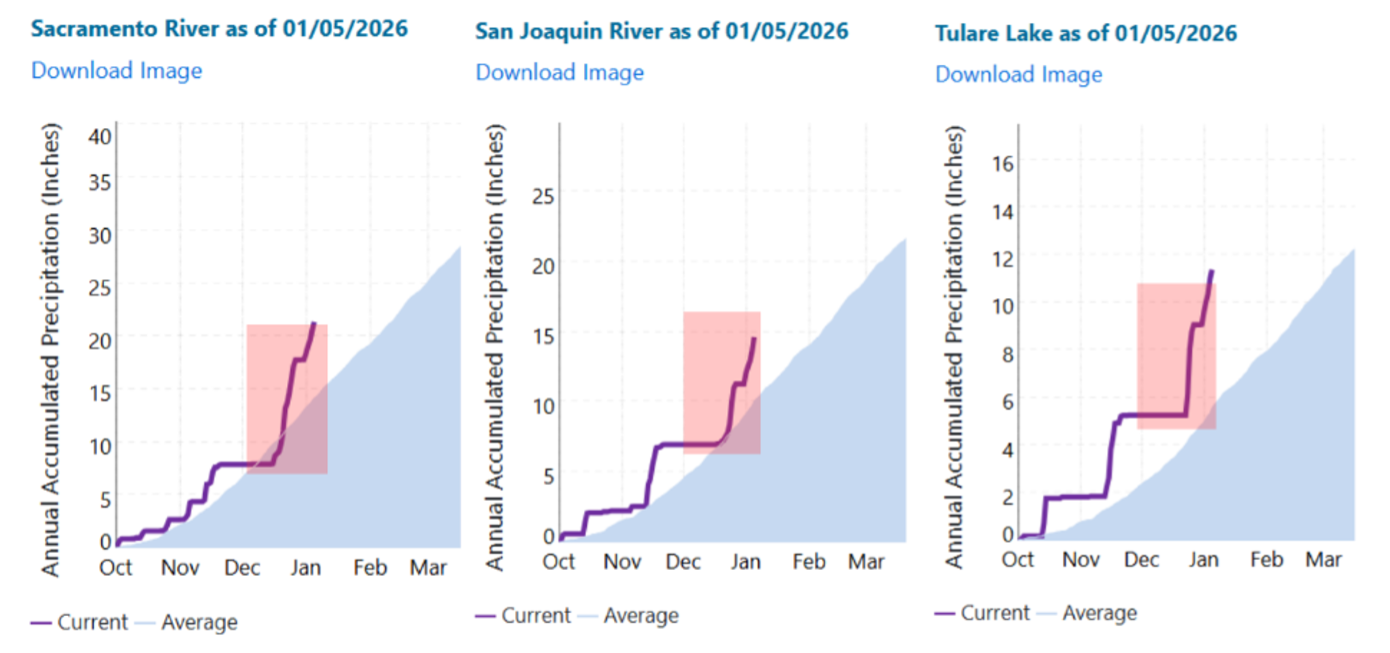
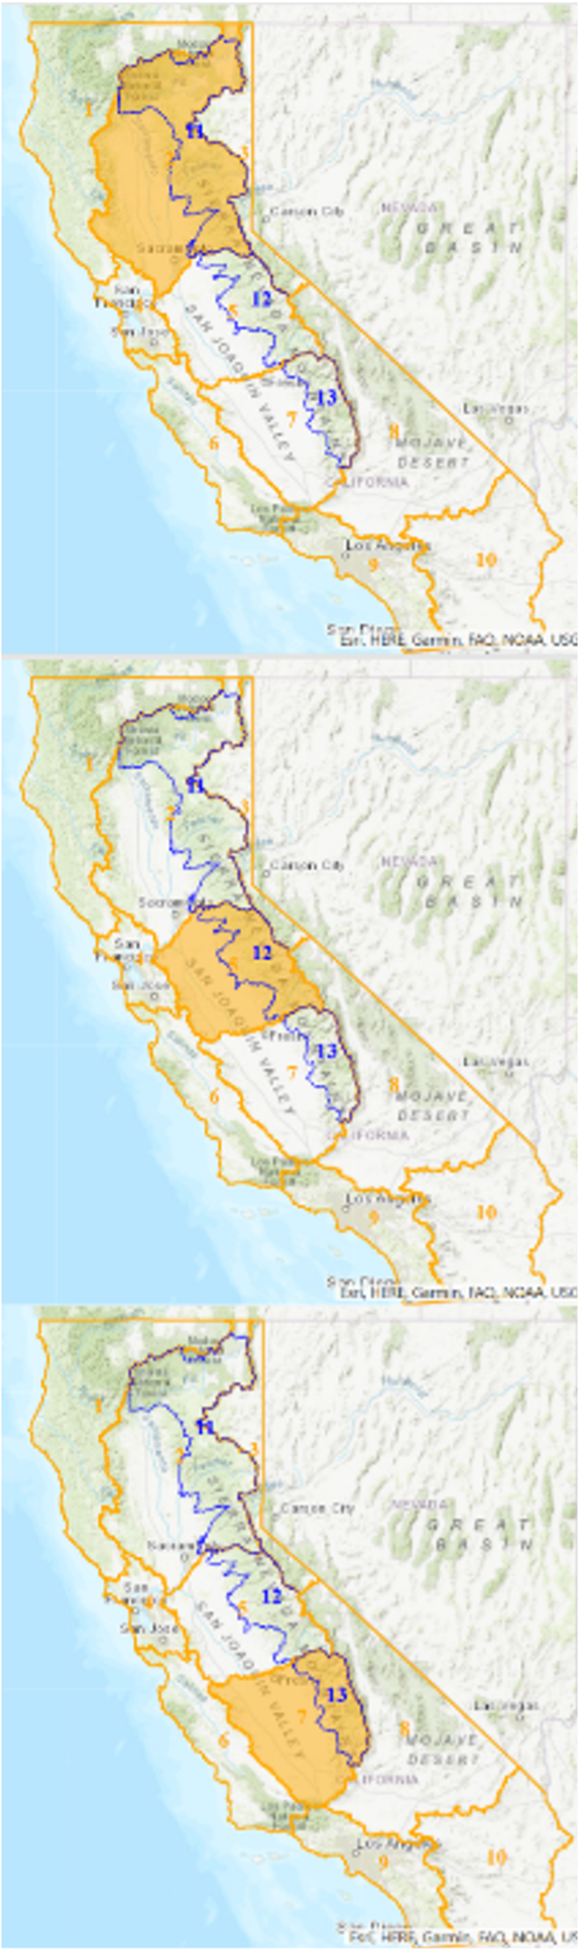
Using California Water Watch regional data, we can see how water year accumulations changed from before the storms (December 16) to after (January 5) for 3 key hydrological regions (see map).
- Sacramento River Region: 7.98″ (81% of average to date) → 21.39″ (151% of average to date)
- San Joaquin River Region: 6.98″ (107% of average to date) → 14.64″ (146% of average to date)
- Tulare Lake Region: 5.27″ (155% of average to date) → 11.39″ (205% of average to date)
The accumulation traces below (purple line) illustrate December’s dramatic shift — from a flat start to a surge of precipitation (highlighted with red shaded box). The blue shading shows the historical average.
The Bigger Picture
While the December storms delivered a meaningful boost, storm accumulations only tell part of the story. The most effective water management decisions are made with a clear understanding of where the entire water year is headed, not just where conditions stand today.
Our customers have had that context since November, with an unchanging forecast of total water year precipitation that allows them to be proactive rather than reactive. That perspective helps support informed decisions about operations, allocations, and risk.
And it’s not too late.
If you’d like to discuss a subscription or see how a full water-year outlook can support your planning, give us a call.