October 21, 2025
CAP is more than just one forecast.

Our November Forecast is Just the Beginning
Now’s the time to subscribe— And if you’re wondering whether there is value beyond the initial forecast, read on!
When Weather Tools issues the CAP forecast each November, we provide a fixed-range outlook for total water-year precipitation. That may sound like a single forecast, but it delivers ongoing value. Our monthly progress reports provide actionable guidance all year.
Because the CAP forecast has verified nine consecutive years, we can confidently compare current accumulation to the forecasted finish line to identify the deficit. That gap is a guide: it shows how much precipitation likely remains and helps customers see how it may affect their operations.
In WY 2022–23, CAP called for 20–40% above normal precipitation. Yet by January 2023, accumulations were still ~60% below normal—a big gap to our forecasted finish line. Weather Tools called for a wet spring in our January progress report and customers adjusted operations accordingly.
Then came the rain: a parade of atmospheric rivers in the back half of the season, capped by Tropical Storm Hilary in August. By year’s end, California finished at 43.3% above normal.
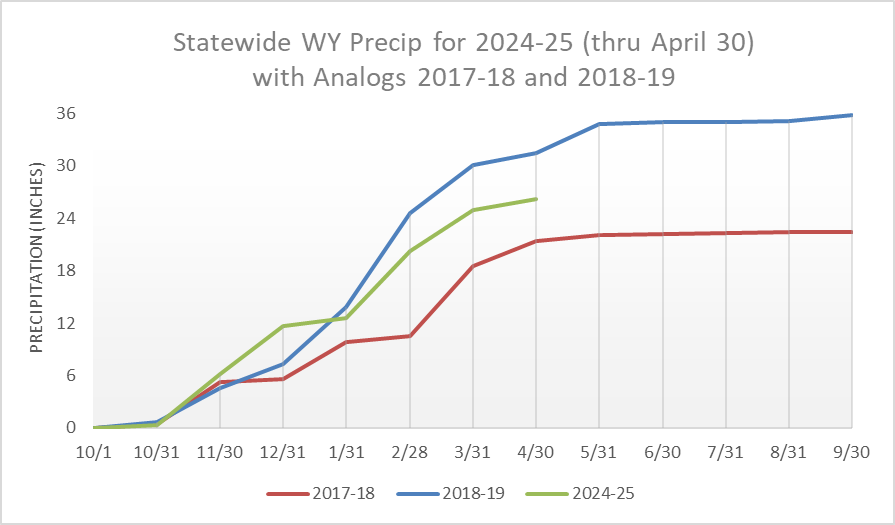
We also identify analog years—past seasons that most closely mirror the current one—to add timing and pattern context.
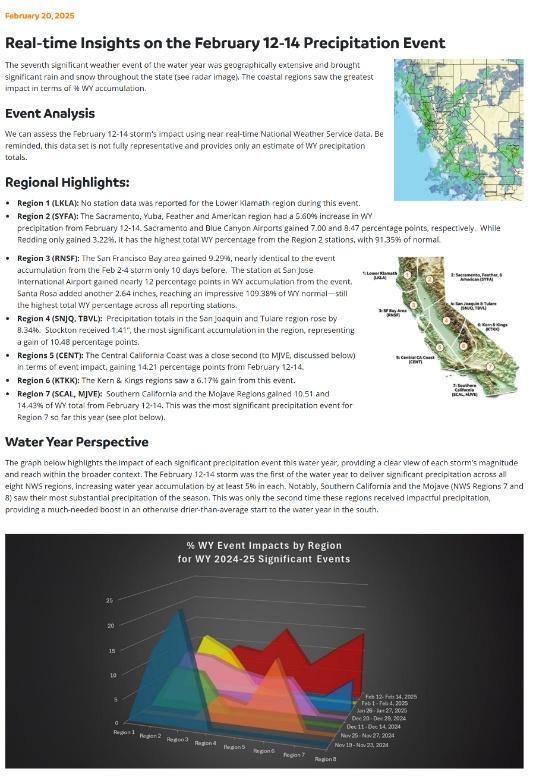
On top of the monthly updates, we send ad-hoc event summaries after significant storms (see screenshot from Weather Tools portal), estimating their impact on accumulation totals, so you always know where you stand.
While November delivers the headline, the real value is the guidance that follows all year. Every monthly update ends with an open invitation to ask questions, as our goal is simple: provide clarity from start to finish.
Want to learn more? Schedule a call.